Population | 1837 | 1847 | 1853 | 1863 | 1869 | 1876 | Ward Map |
Growth by Annexation – 1830-1935
The date of the first meeting of the Board of Trustees took place on August 12, 1833.
To change the Corporate Power of the Town of Chicago, that expanded the area of the town and the powers of the trustees, the earliest incorporation by the legislature, was approved on February 11, 1835. The original boundaries of the colony were Kinzie Street (N), State Street (E), Madison Street (S) and Halsted Street (W). In 1837, Chicago’s population reached four thousand and was chartered as the City of Chicago.
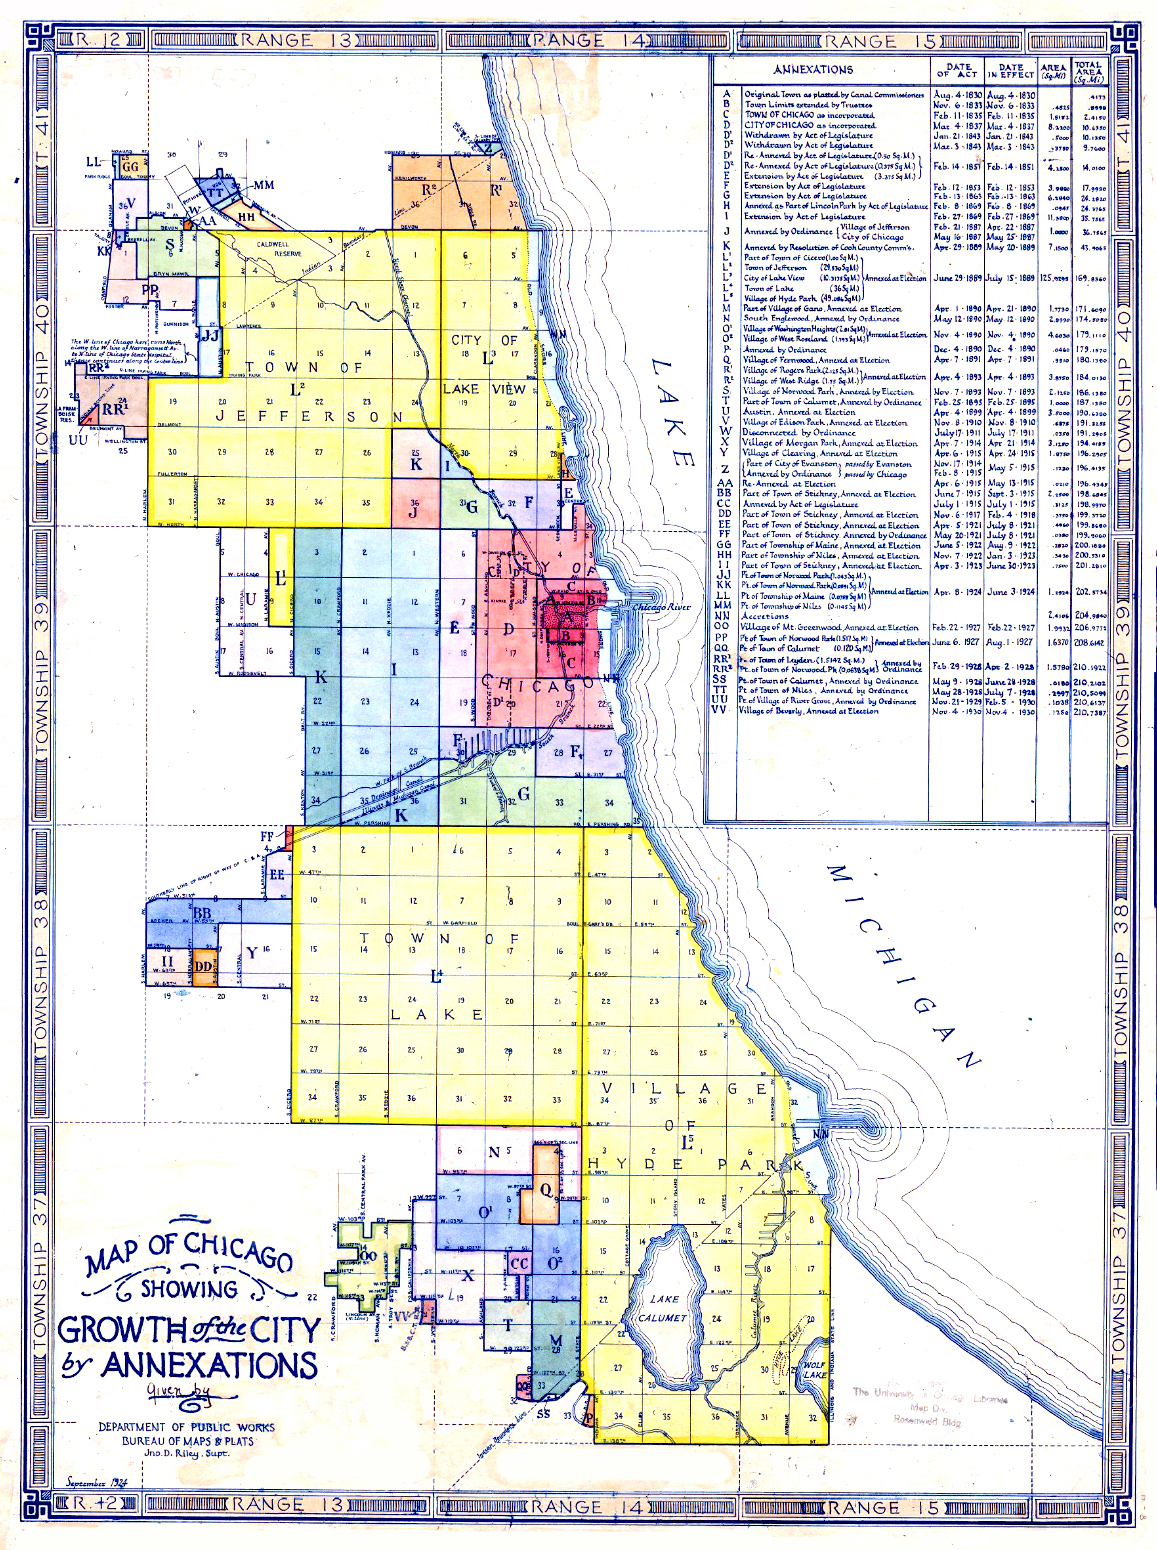
- Map Showing the Territorial Growth of Chicago.
Chicago Department of Public Works, Bureau of Maps and Plats
1930
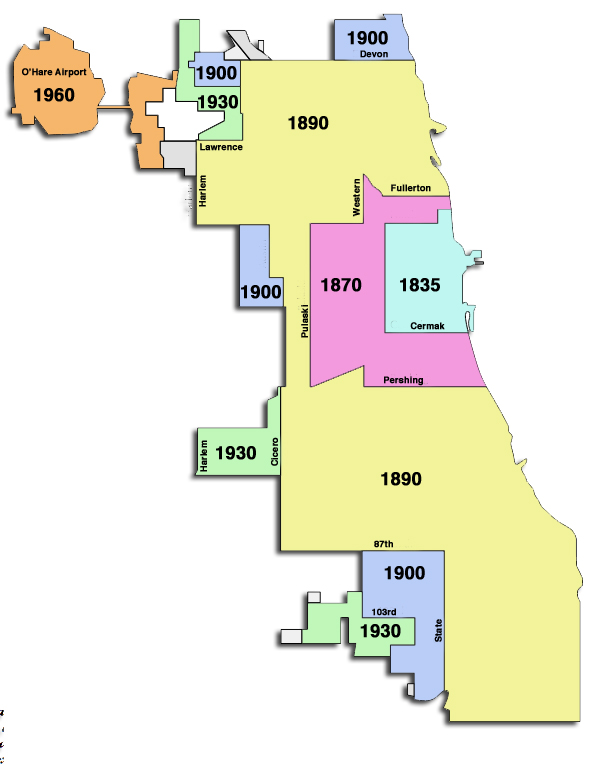
- Simplified chart showing Growth of Chicago through Annexation
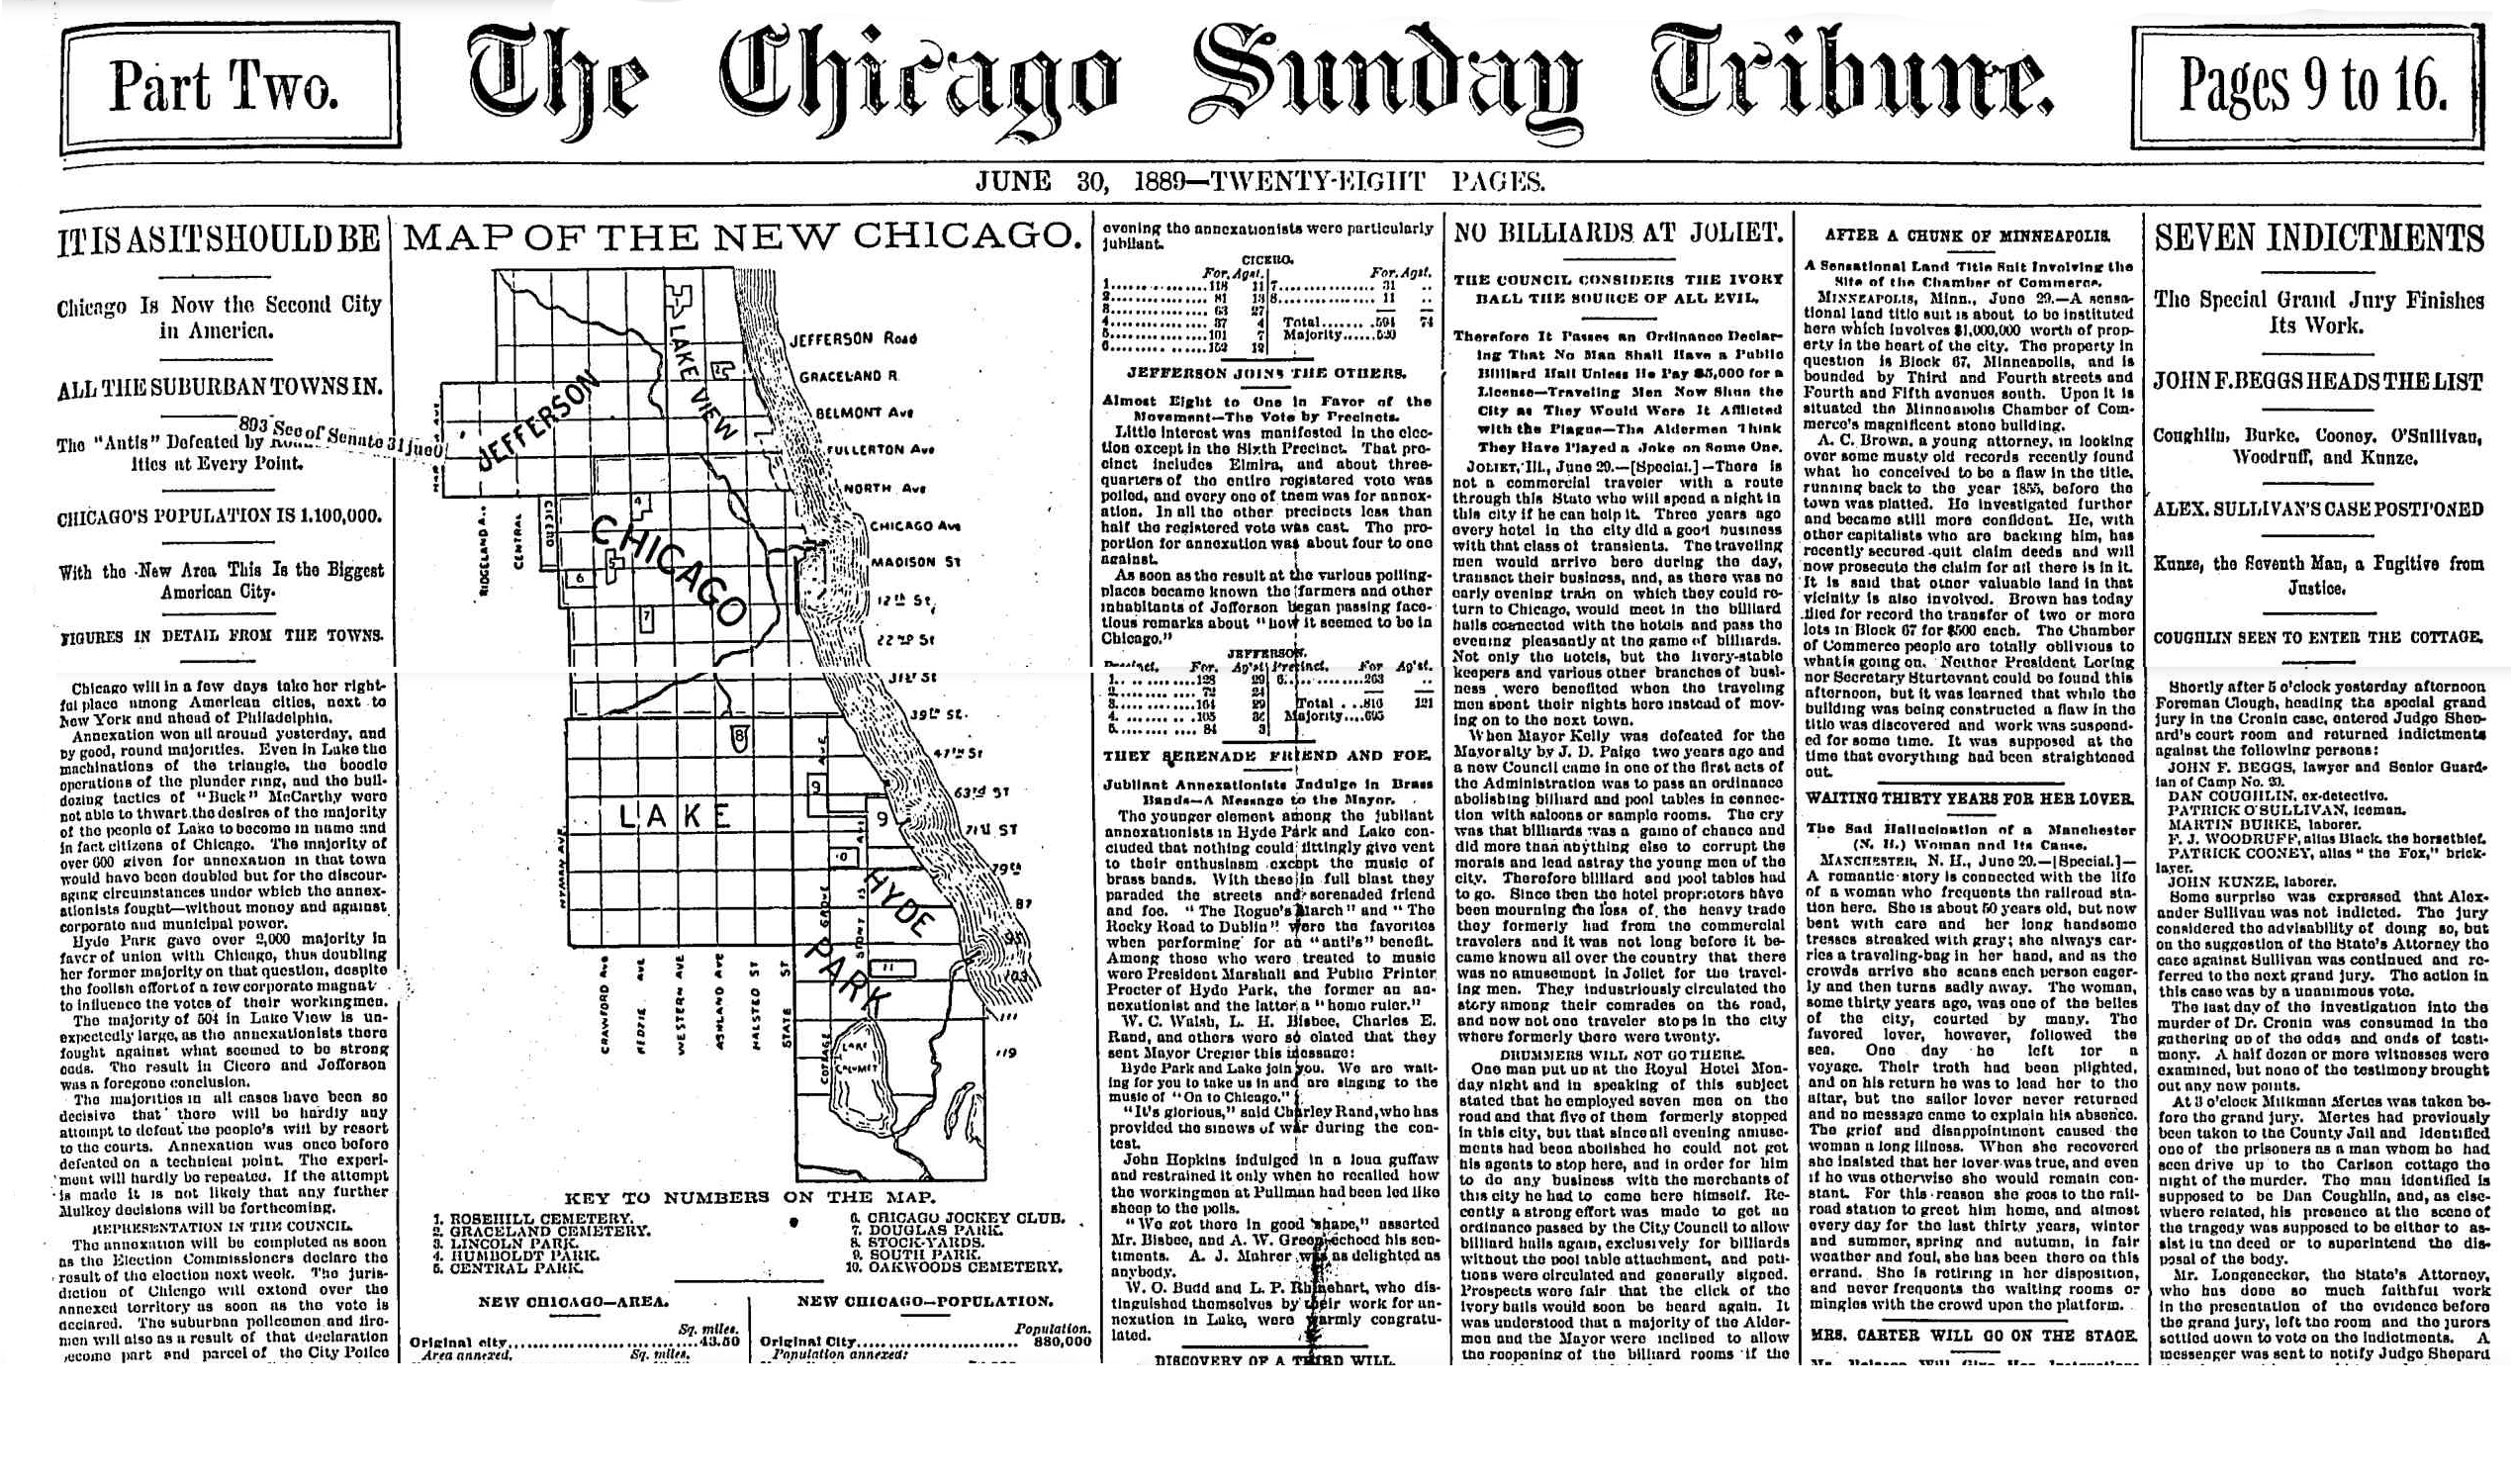
Chicago Tribune, June 30, 1889
Chicago Population Growth by Decade
The following table shows the population of Chicago between 1830 and 2020. The number for 1830 is estimated.
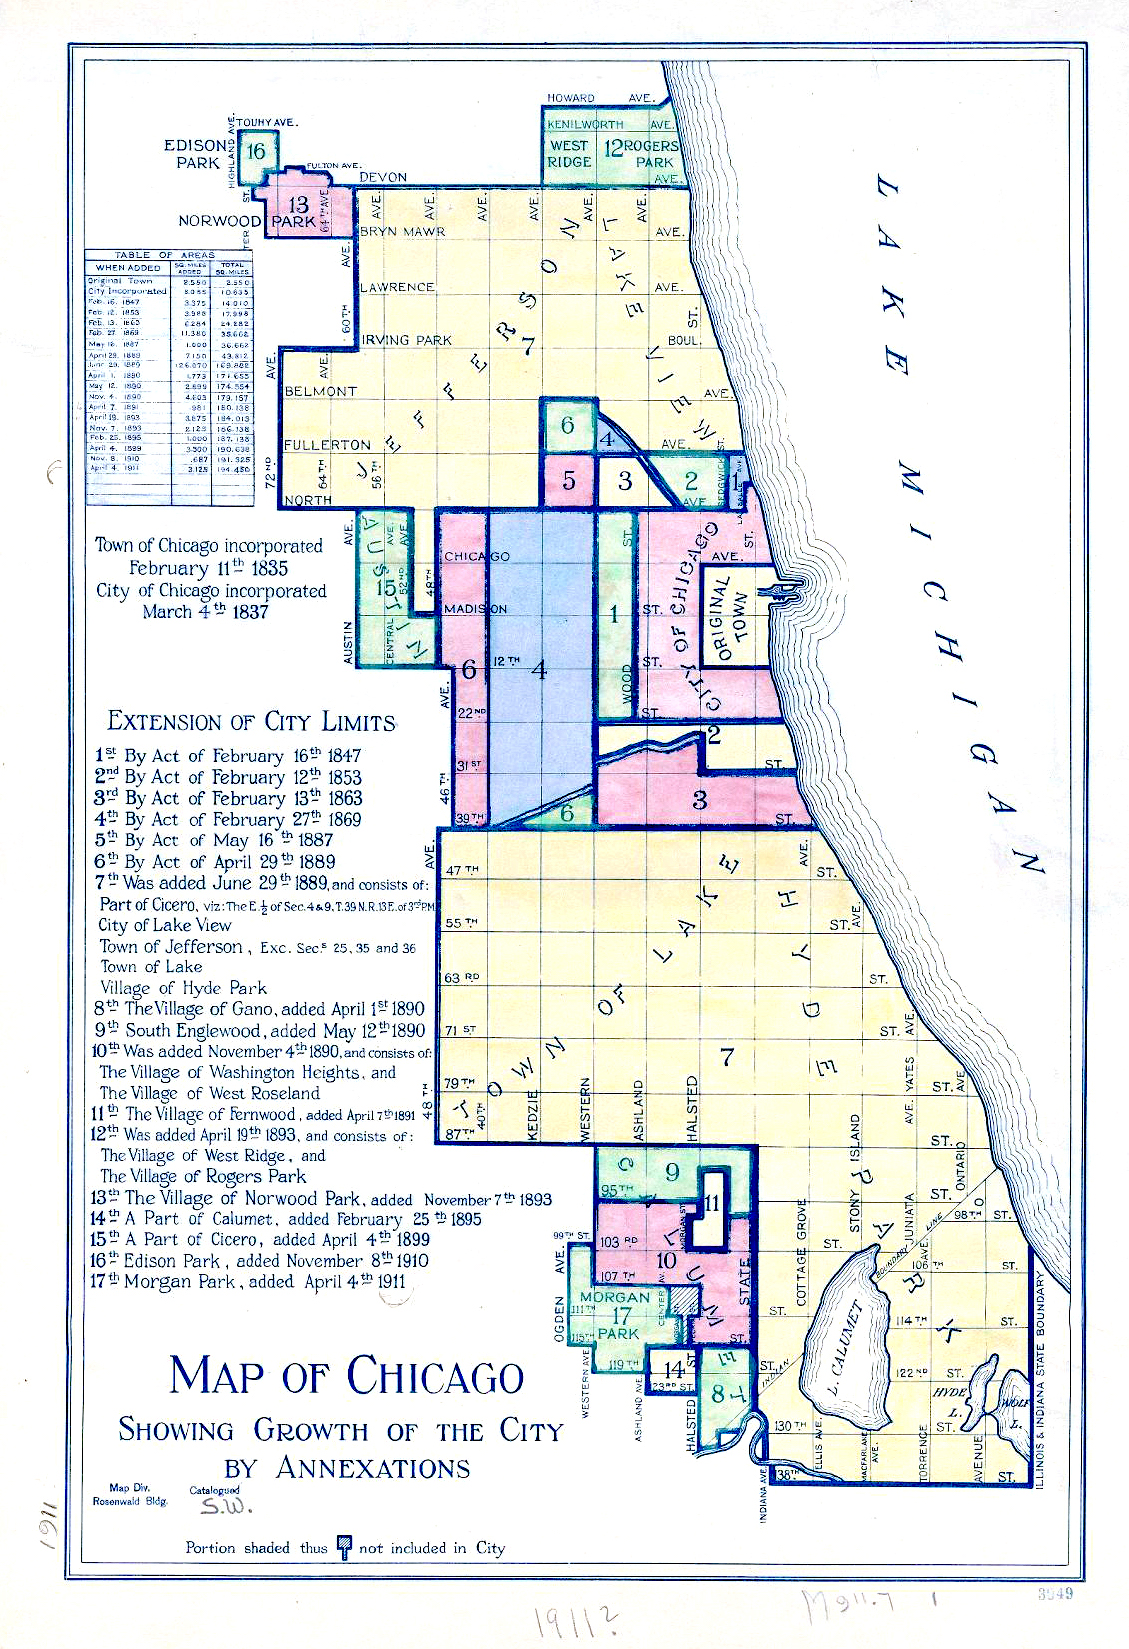
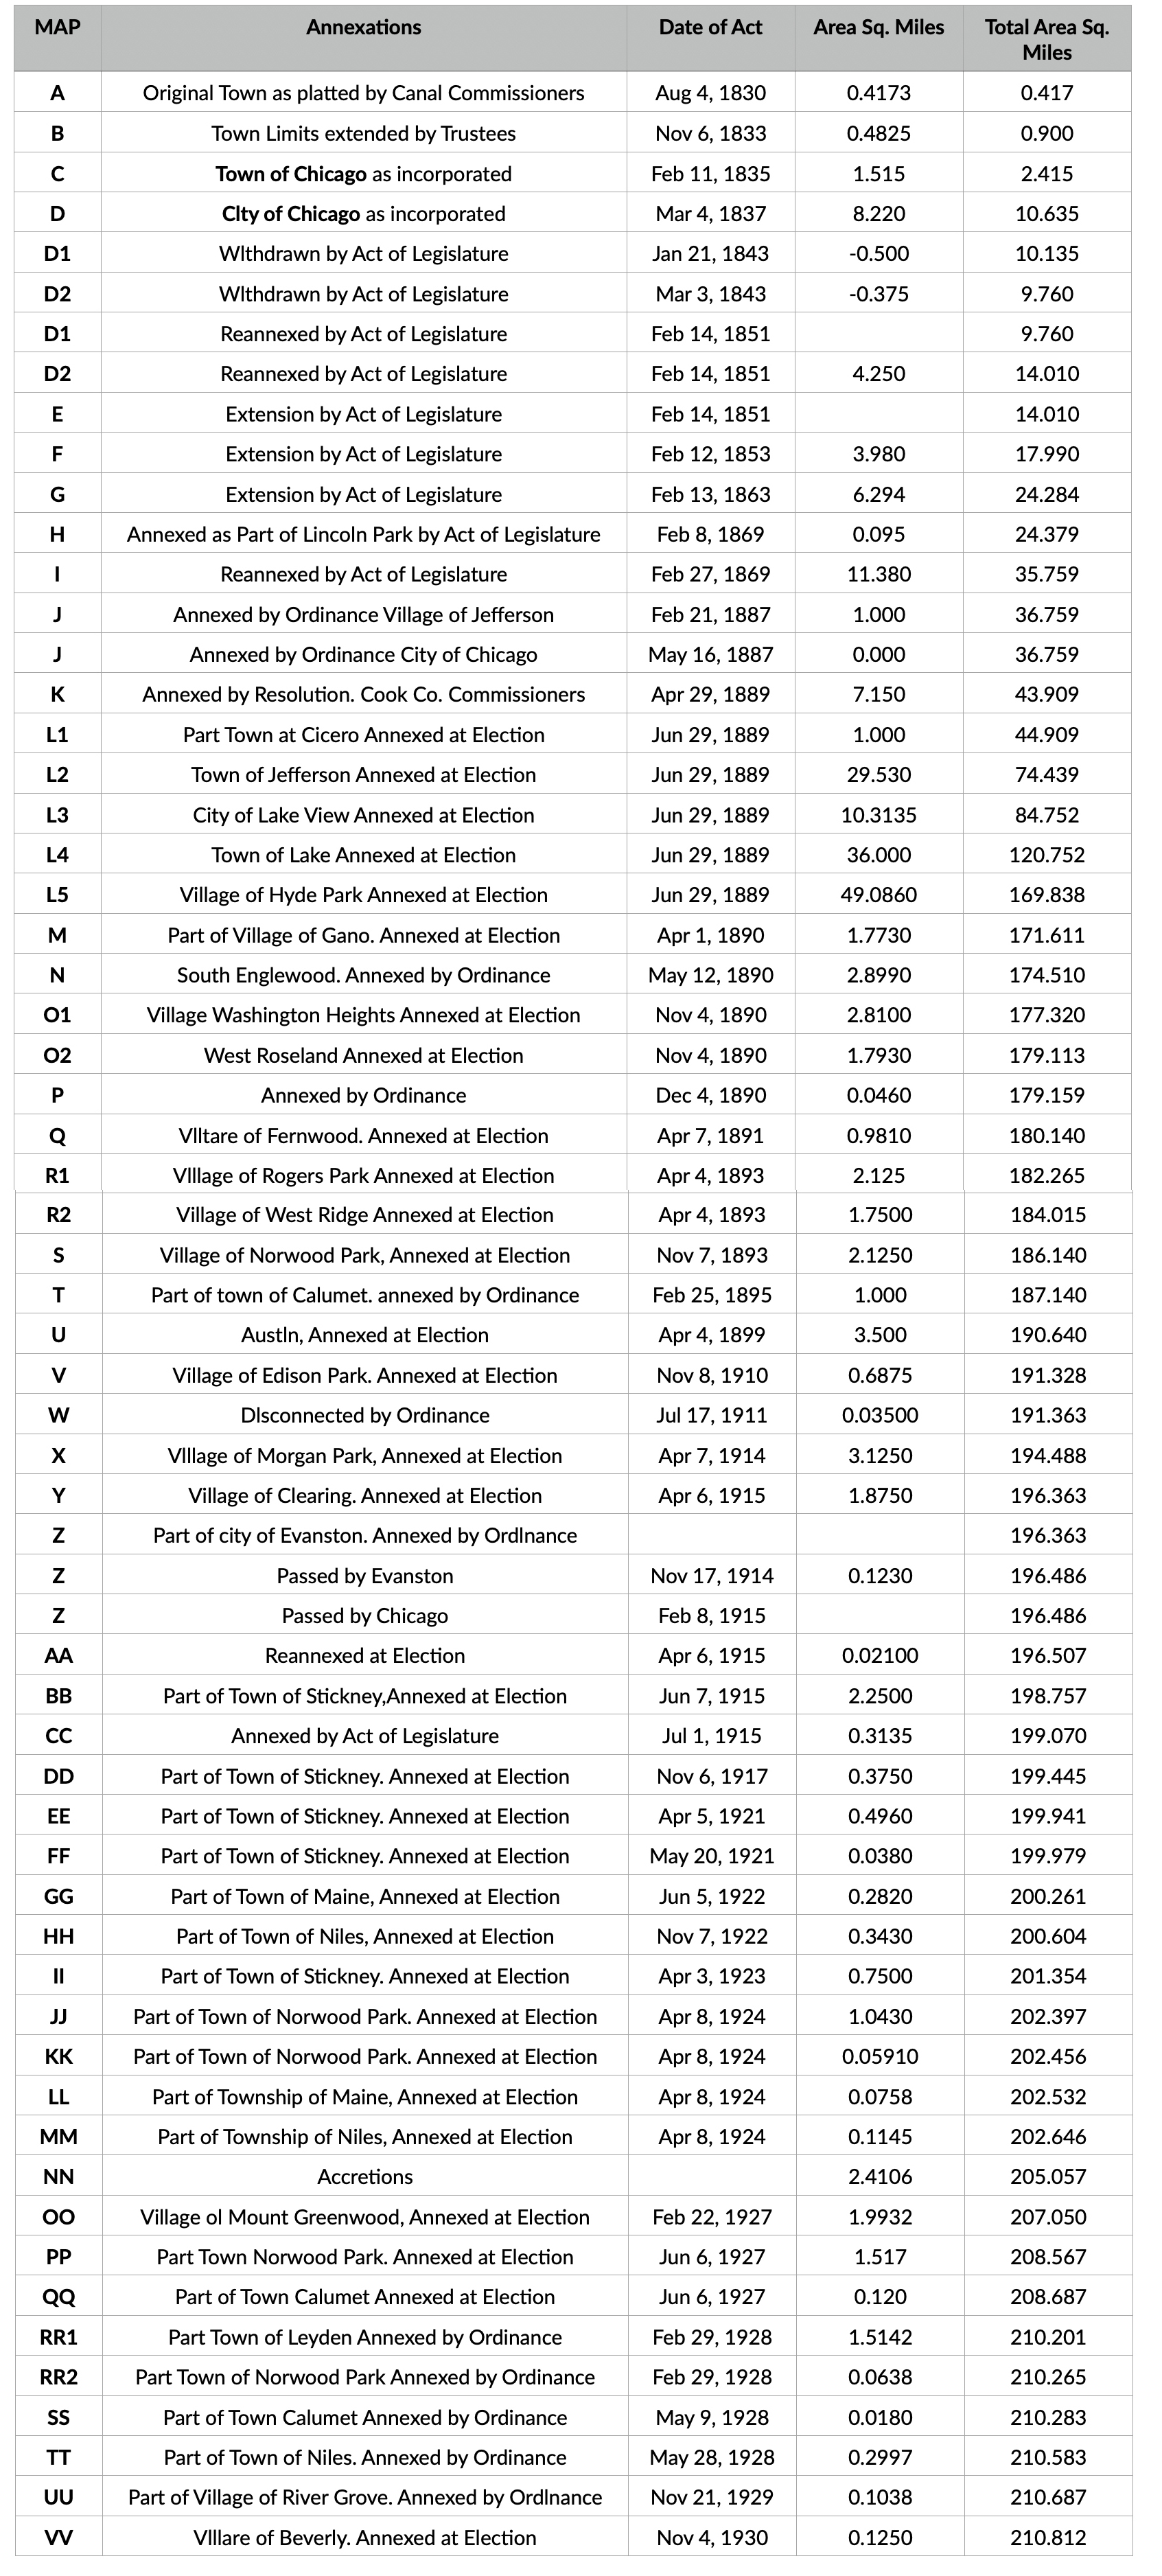
- Chicago Annexations
1911
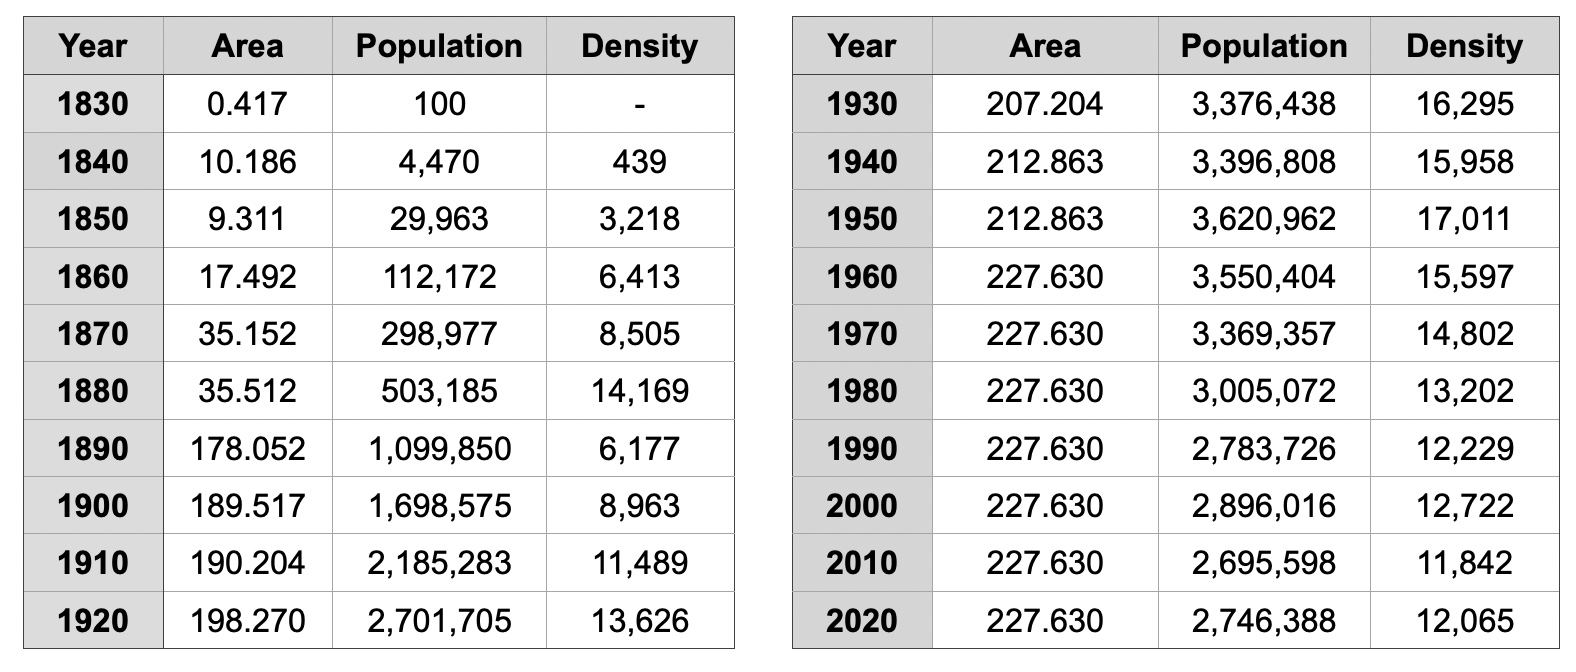
Source: United States Census
NOTES:
New York City population in 2020 is 8,804,190 on 300.46 square miles of land (Density 29,302).
Los Angeles population in 2020 is 3,898,747 of 468.70 square miles of land (Density 8,318).
[…] the border between the city of Chicago and the city of Hammond. (Chicago extended out this far in massive 1889 annexation, which is yellow on this […]